
Quick answer: The email metrics worth tracking are open rate, click-through rate (CTR), click-to-open rate, conversion rate, bounce rate, unsubscribe rate, and spam-complaint rate. Mailchimp’s benchmark data (last updated December 2023) puts the all-industry average open rate at 35.63%, click rate at 2.62%, and unsubscribe rate at 0.22% (Mailchimp). But treat open rate with caution — Apple’s Mail Privacy Protection inflates it, and Google says it doesn’t even track opens. Click-based metrics and complaint rate are the honest signals.
There are a dozen numbers in every email report, and staring at all of them equally is how you miss the ones that matter. This guide covers each core email marketing metric, what a good benchmark looks like, and which numbers to trust now that privacy tools have made open rates unreliable.
Which email metrics should you track?
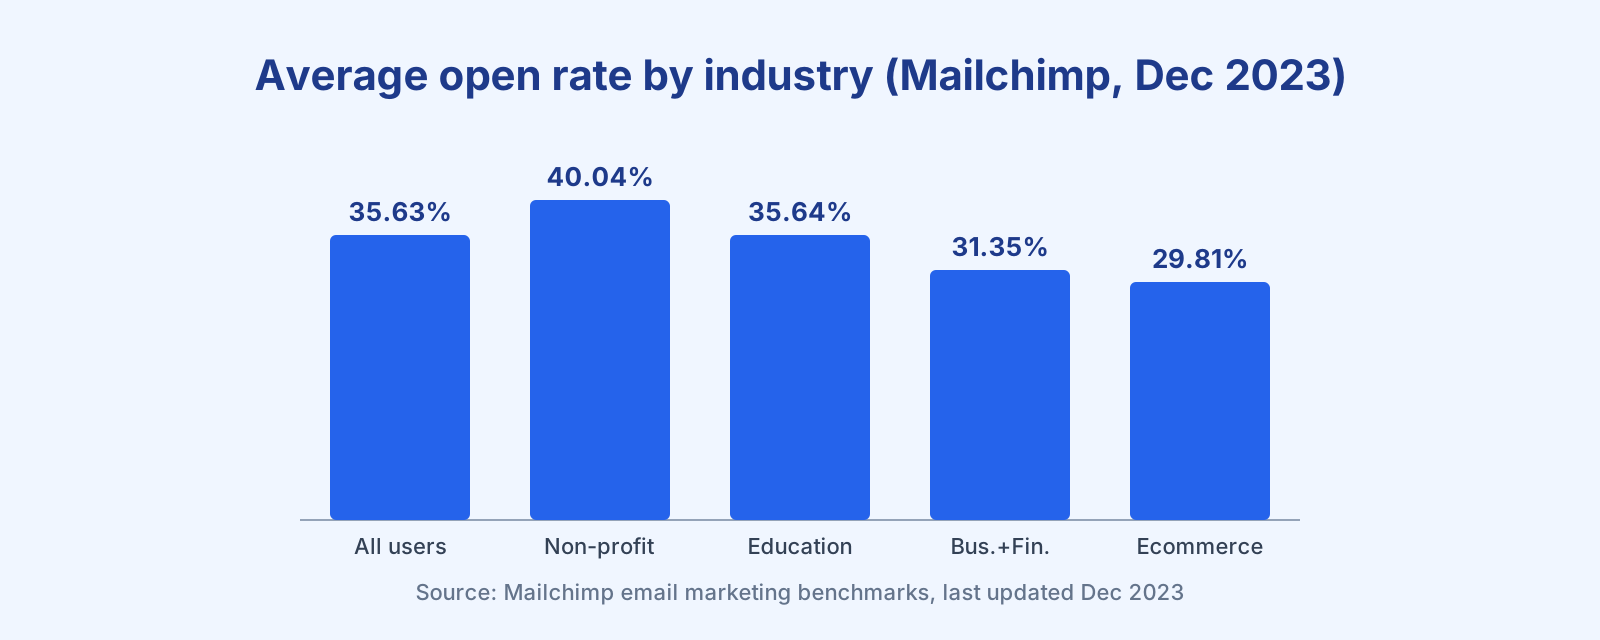
Start with the metrics that map to a real outcome, not vanity. Mailchimp’s benchmarks give an industry baseline to compare against:
| Industry | Avg. open rate | Avg. click rate | Unsub rate |
|---|---|---|---|
| All users | 35.63% | 2.62% | 0.22% |
| Non-profits | 40.04% | 3.27% | 0.18% |
| Education + training | 35.64% | 3.02% | 0.18% |
| Business + finance | 31.35% | 2.78% | 0.15% |
| Ecommerce | 29.81% | 1.74% | 0.19% |
Source: Mailchimp benchmarks, data last updated December 2023. Use your own industry row, not the overall average — a 30% open rate is below par for a non-profit but strong for ecommerce.
Open rate: useful, but no longer trustworthy alone
Open rate is the percentage of delivered emails that were opened. It’s the headline metric everyone quotes — and the one privacy tools have quietly broken. Mailchimp flags the issue directly: open-rate accuracy “may be impacted by Apple’s privacy changes and their Mail Privacy Protection (MPP) feature” (Mailchimp). MPP pre-loads the tracking pixel whether or not the human opened the email, inflating the number.
Google is even blunter: “Google doesn’t track open rates… Low open rates aren’t necessarily an accurate indicator of deliverability or spam classification issues” (Google). Treat open rate as a rough trend line, not a precise measure.
Click-through rate and click-to-open rate: the honest engagement signals
Click-through rate (CTR) — the share of delivered emails that got a click — is harder to fake and closer to real interest. Mailchimp’s all-industry average is 2.62%, and its data puts the “optimal” CTR around 2.66%, ranging 1–5% by industry (Mailchimp). Matt Schott, Senior Lead Gen Strategist at thunder::tech, makes the case for it in Mailchimp’s own report: “Good old-fashioned click-through rate is one of the most meaningful statistics to track in your email marketing software. This, layered with audience size, can really be the foundation of a list that’s ready to be leveraged towards achieving significant business objectives” (Mailchimp).
Click-to-open rate (clicks divided by opens) is increasingly the metric practitioners lean on, because it measures how compelling your content was to the people who actually saw it — and it’s less distorted by MPP than raw open rate.
Conversion rate: the metric that pays the bills
Clicks are a milestone, not the goal. Conversion rate — the share of recipients who took the action you wanted (purchase, signup, booking) — is what ties email to revenue. It lives partly outside the email, on your landing page, so improving it means aligning the email’s promise with the page it leads to. Good segmentation and personalization are the biggest levers here, because relevant mail converts far better than a blast.
Deliverability metrics: bounce rate and spam-complaint rate
These are the health metrics that decide whether any of the above even matters — if you don’t reach the inbox, nothing else counts.
Bounce rate should sit well under 2%, and Postmark’s hard ceiling is that it “should never exceed 10%” (Postmark). See the full email bounce rate explainer.
Spam-complaint rate is the one mailbox providers enforce. Google requires bulk senders to keep complaints in Postmaster Tools below 0.10% and never reach 0.30% (Google). Cross that line and your inbox placement drops. Mailchimp’s data puts the average unsubscribe rate at 0.22% — a healthy unsubscribe is fine, but a rising complaint rate is an emergency.
Unsubscribe rate: not the enemy
A steady unsubscribe rate (Mailchimp’s average is 0.22%) is normal and even healthy — people removing themselves is better than them marking you as spam. Watch for spikes, which signal a content or frequency problem worth investigating; the fix usually lives in email frequency best practices.
Frequently asked questions
What is a good email open rate? Mailchimp’s all-industry average is 35.63%, but it varies widely by industry (non-profits ~40%, ecommerce ~30%). Treat open rate cautiously — Apple MPP inflates it and Google doesn’t track it.
What is a good click-through rate for email? Around 2.62% across industries per Mailchimp, with an optimal near 2.66% and a typical range of 1–5%. CTR and click-to-open rate are more trustworthy than open rate.
Why is open rate unreliable now? Apple’s Mail Privacy Protection pre-loads the tracking pixel regardless of a real open, inflating the number. Google states it doesn’t track opens and that low open rates aren’t a reliable deliverability signal.
What email metric matters most? For engagement, click-through and click-to-open rate; for revenue, conversion rate; for survival, bounce rate and spam-complaint rate. Complaint rate must stay under 0.30% for Gmail.
What’s an acceptable unsubscribe rate? Around 0.22% is the Mailchimp average. A steady rate is healthy; a sudden spike signals a frequency or relevance problem.
References
- Mailchimp — Email Marketing Benchmarks (Matt Schott, thunder::tech): https://mailchimp.com/resources/email-marketing-benchmarks/
- Google — Email sender guidelines: https://support.google.com/a/answer/81126
- Postmark — Email bounces guide: https://postmarkapp.com/guides/email-bounces
— Shivam